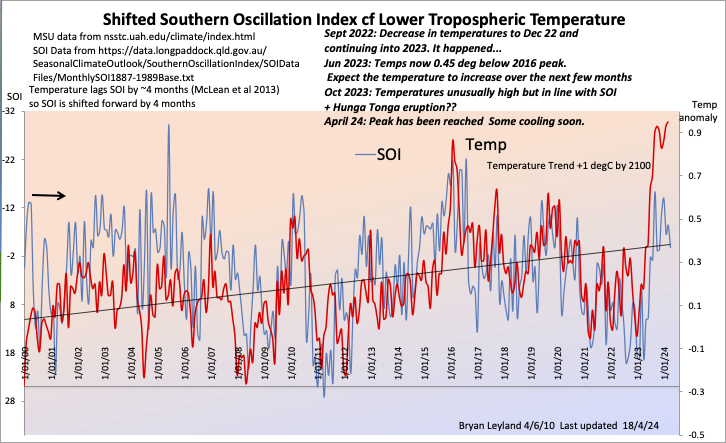
Global Temperature follows the Southern Oscillation Index (El Nino effect)
As the chart below shows, there is a good correlation between world temperatures and the SOI four months previously. This means that, volcanoes apart, temperatures can be predicted with reasonable accuracy 4 months ahead.
It is quite remarkable that the climate models still cannot predict the timing and magnitude of El Nino and La Nina.
Below is a list of predictions I have made since 201o and their outcome.
As predicted, 2011 and 2012 were cool. As predicted, there was no significant warming during 2014.
24 Mar 16: "The El Nino event has ended and temperatures will drop rapidly over the next 6 months." They did
2 July 16: "Temperatures dropped as predicted in March and will continue to drop for the next four months or so. As the drop is rapid, it now seems to be unlikely that 2016 will be the hottest year since satellite records began." In fact, it was – by a miserable 0.02°. At that rate, the world will be something like 0.1° warmer by the end of the century.
11 April 17: "Temperatures continued to drop until the end of 2016. It appears likely that they will stabilise or drop slowly over the next few months." They dropped.
4 Jan 2020 "Temperatures continue to follow SOI. Expect some cooling over the next few months." Some cooling.
3 Jan 2021 "A severe La Nina appears to have set in and there has already been a sharp drop in temperature. Given the four-month time lag, this could continue for at least four months and probably longer. There is a reasonable chance that 2021 will be cooler than 2020 which was cooler than 2016 which was much the same as 1998. Where is the evidence of a "climate emergency". Is it the beginning of global cooling? The only thing we can be sure of is that the climate model predictions have turned out to be too hot."
19 March 2022 "Since 2020 the world has warmed at rate of only 1 degC/century and has not warmed since 2016 – in fact it has cooled by more than 0.5°. NOAA predicts that the current La Nina will probably last beyond spring. If it does, we cannot expect warming this side of November 22. Whether or not it will then warm significantly, is anybody's guess. Many people who study climate cycles are predicting continued cooling driven largely by the lack of sun spots.
What next?
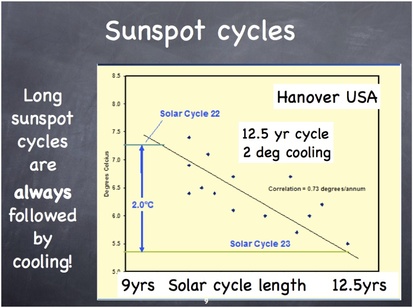
Records from all over the world show that a long sunspot cycle is followed by cooling in the next cycle and a short sunspot cycle indicates warming. The last sunspot cycle was 12.5 years and the previous one was 9.5 years. The evidence tells us that a 3 year increase in cycle length will result in cooling of at least 1°C. As the total amount of warming that has occurred since the early 1900s is 0.7°C, this is potentially very serious. We could be returning to the conditions in the little ice age.
This is confirmed by the very weak solar cycle with no sunspots for significant periods.
History tells us that cooling causes crop failures, famine, disease and, often, war.
We must not forget that the climate changes naturally and we need to be prepared for climate change–be it cooling or warming.